WORLD GOLD COUNCIL GOLD DEMAND TRENDS: 1Q 2016
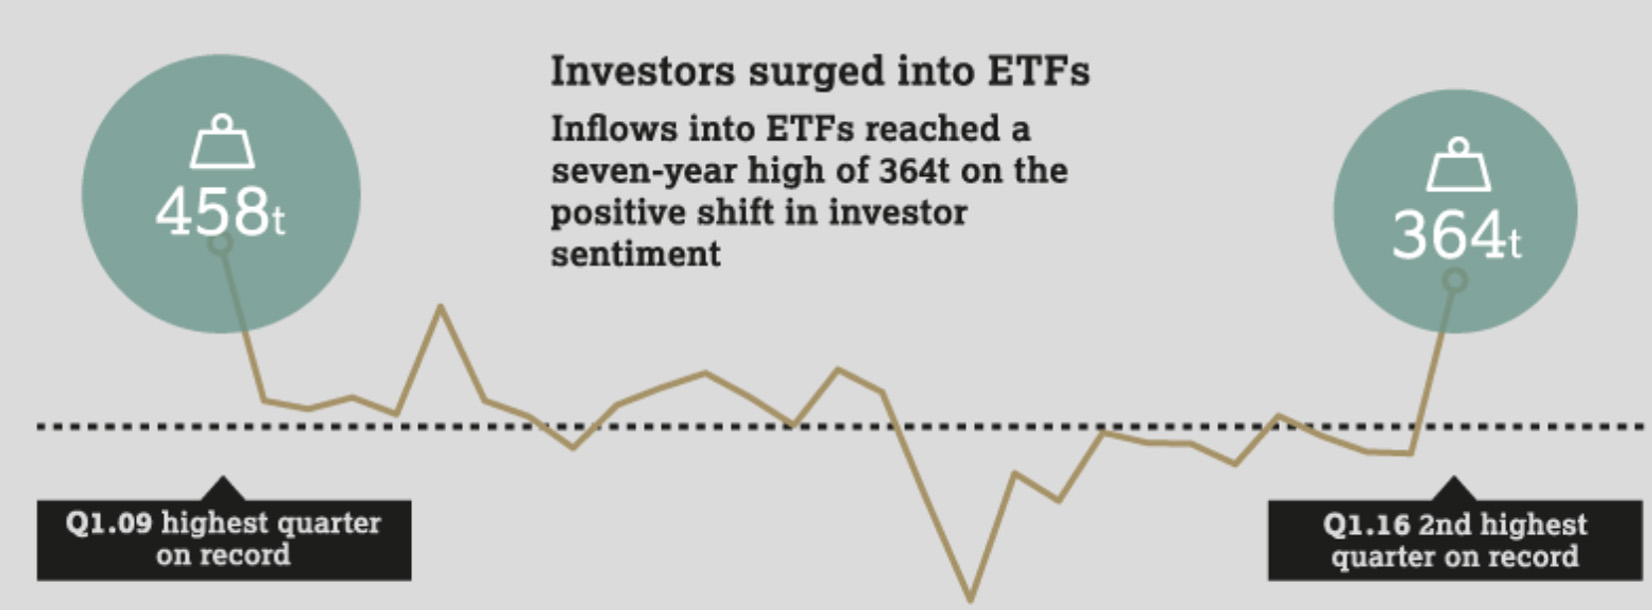
Gold demand reached 1,290 tonnes Q1 2016, a 21% increase year-on-year, making it the second largest quarter on record. This increase was driven by huge inflows into exchange traded funds (ETFs) – 364t – fuelled by concerns around the shifting global economic and financial landscape. Higher prices and industrial action in India pushed global demand for jewellery down (-19%), while total bar and coin demand was marginally higher (+1%). Central banks remained strong buyers, purchasing 109t in the quarter. Total supply increased 5% to 1,135t. Hedging by producers (40t) supported an increase of 56t in mine supply, although countered by a marginal decline in recycling.
Gold demand and supply statistics for Q1 2016:
Overall demand increased by 21% year-on-year to 1,289.8t, the strongest Q1 on record.
Global investment demand saw a significant rise of 122% to 617.6t, up from 277.9t in Q1
2015. ETF demand rose >300% to 363.7, the highest since Q1 2009.
Global jewelry demand for Q1 2016 was down 19% year-on-year to 481.9t compared to 596.9t in Q1 2015. In India, demand was down 41% to 88.4t and China was also down 17% to 179.4t.
Central bank demand dropped by 3% to 109.4t, but this is still the 21st consecutive quarter of net purchases.
Demand in the technology sector overall declined 3% to 80.9t while both electronics and dentistry dropped by 3% and 4% respectively, continuing decline of interest of gold being utilized in technology.
Total supply was 1,134.9t in Q1, up 5% year-on-year. Total mine supply (mine production +
net producer hedging) rose 8% year-on-year to 774t compared to 717.7t in the same period last year. Recycling levels were slightly down 1% year-on-year to 360.9t compared to 363.2t in Q1 last year.
Download the FULL REPORT HERE

Sorry, you must be logged in to post a comment.