$GC Gold Ends January on a Monthly High
Gold Breaks Out; Silver Gearing Up for a Move
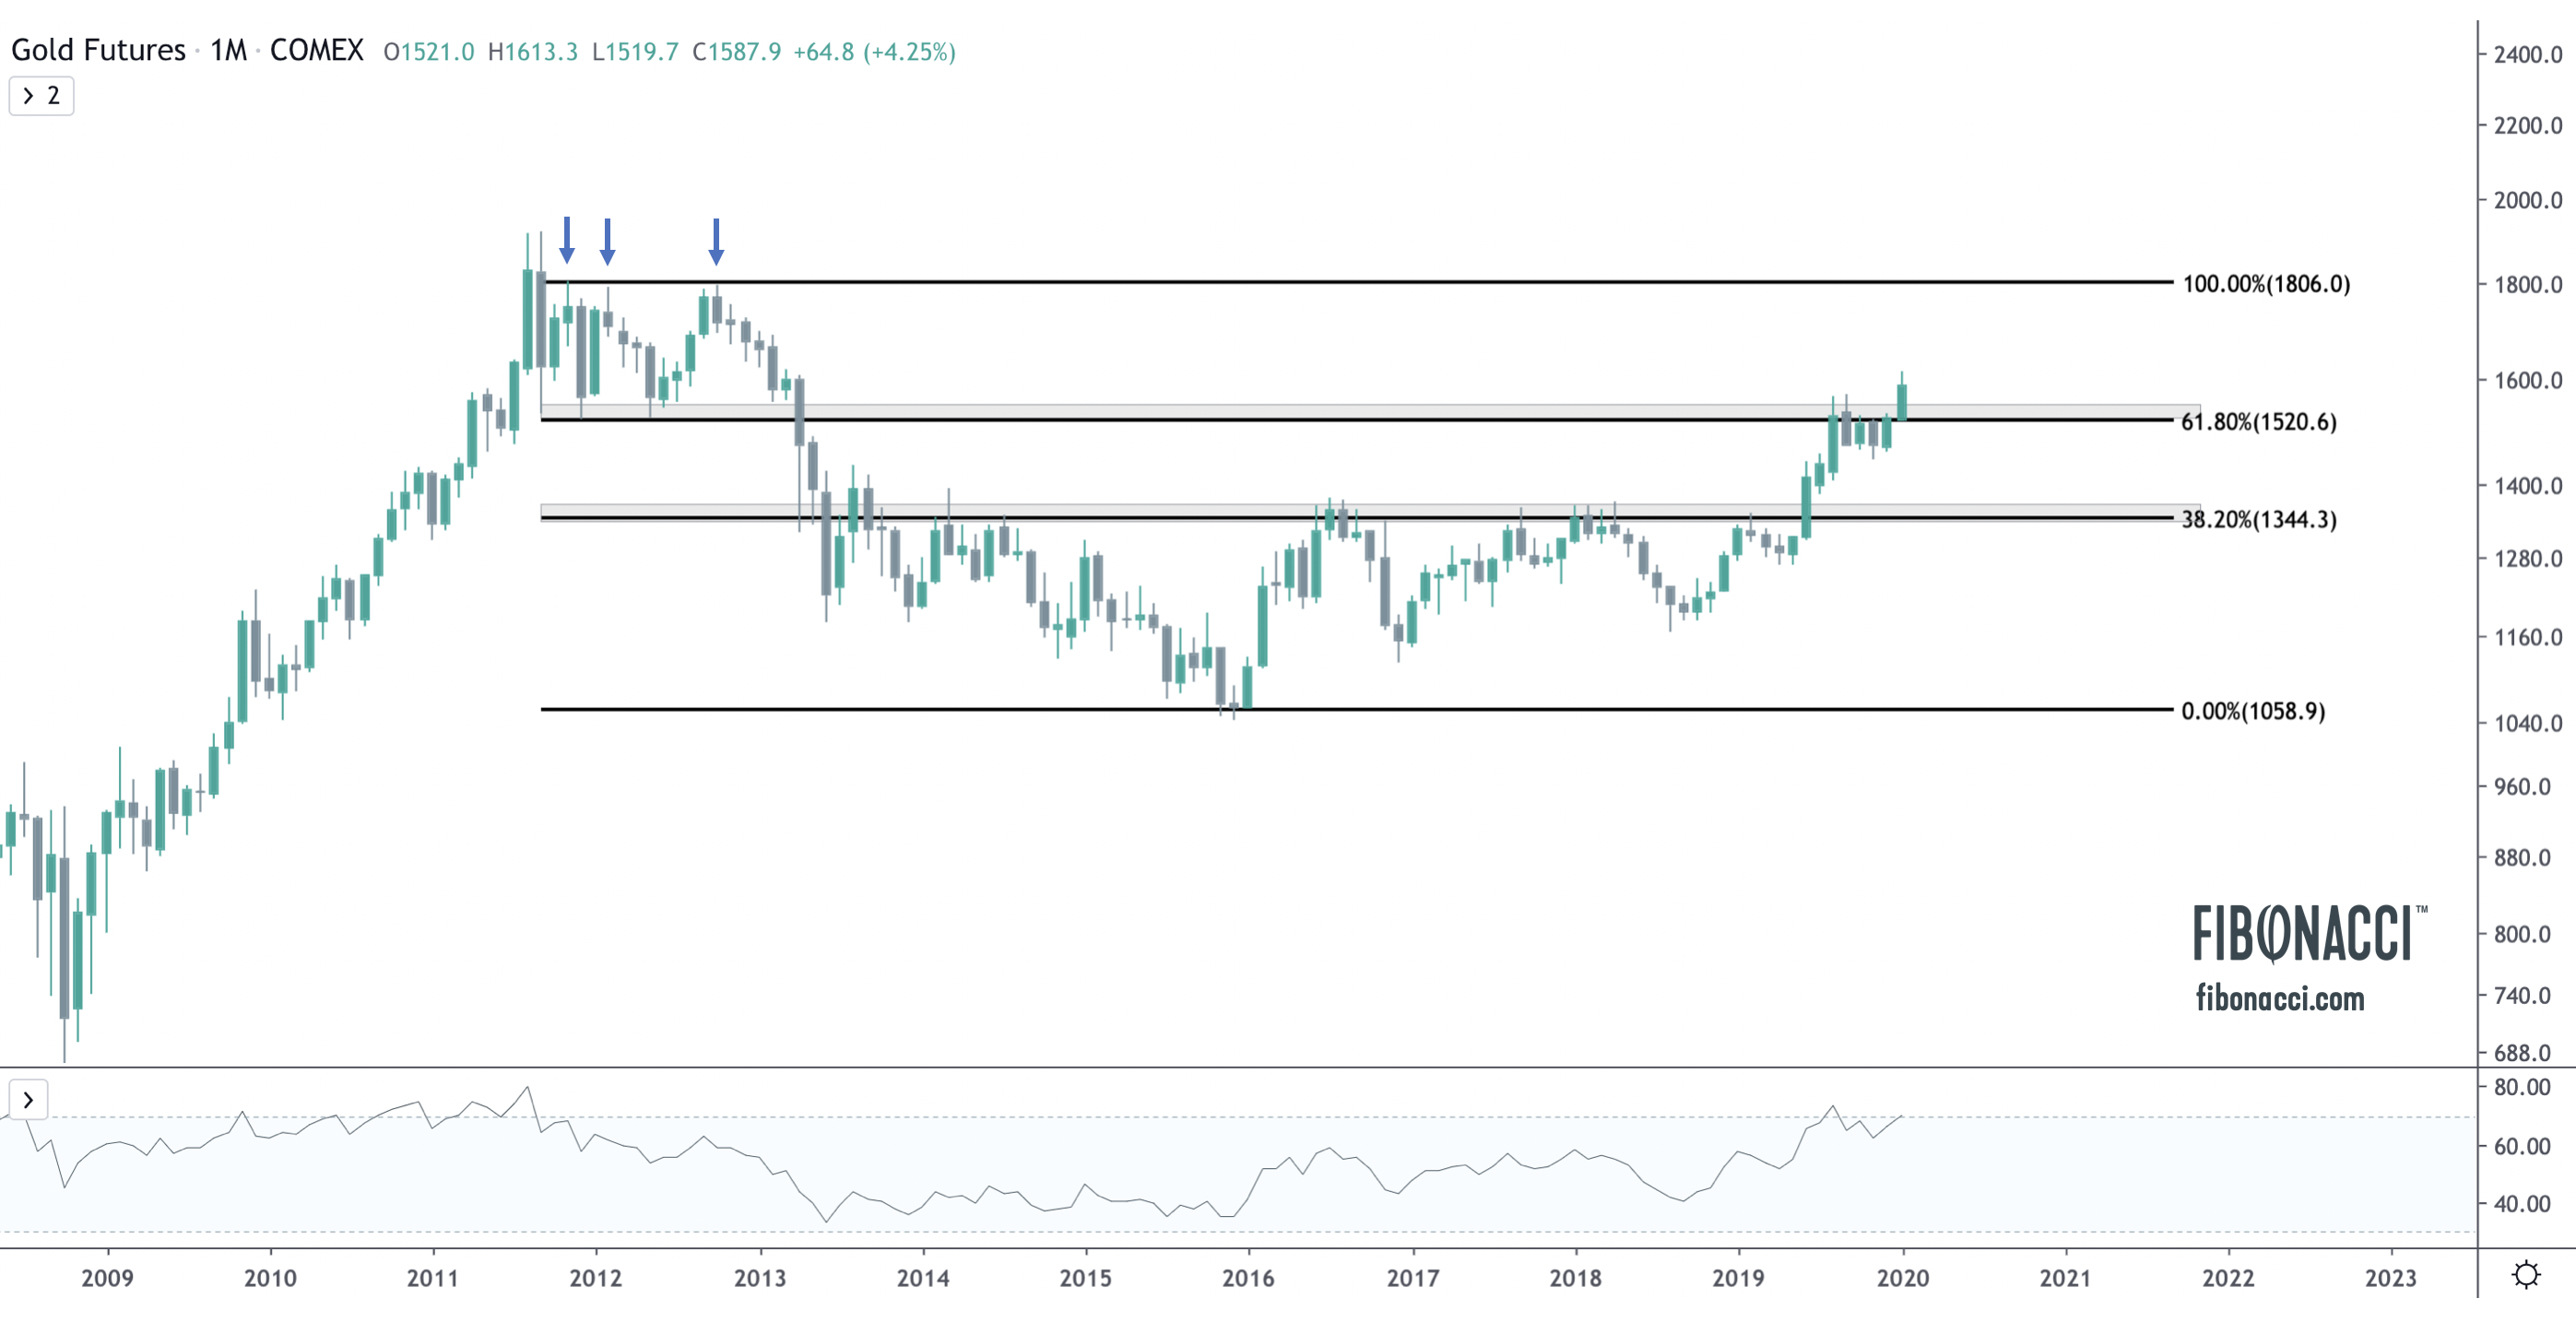
Gold bugs should be pleased with the monthly performance of gold in January. The definitive monthly break of the $1520 level, which had acted as strong monthly support six times between 2011-2013, before serving as resistance during this recent consolidation period between August and December, has sent a bullish longer term signal to the market.
The monthly gold chart (above) has honored the 38.2% and 61.8% fibonacci retracements religiously over the last nine years, which makes this month’s recent breakout all the more significant. In the chart below, you will note that I drew the beginning of my Fibonacci levels from the secondary high in 2011, and not the primary high (the absolute peak). In this case, the year long shelf following the peak is an area of much greater significance and the better location to start the ratios. Thus, the recent break of 61.8% is all the more notable.
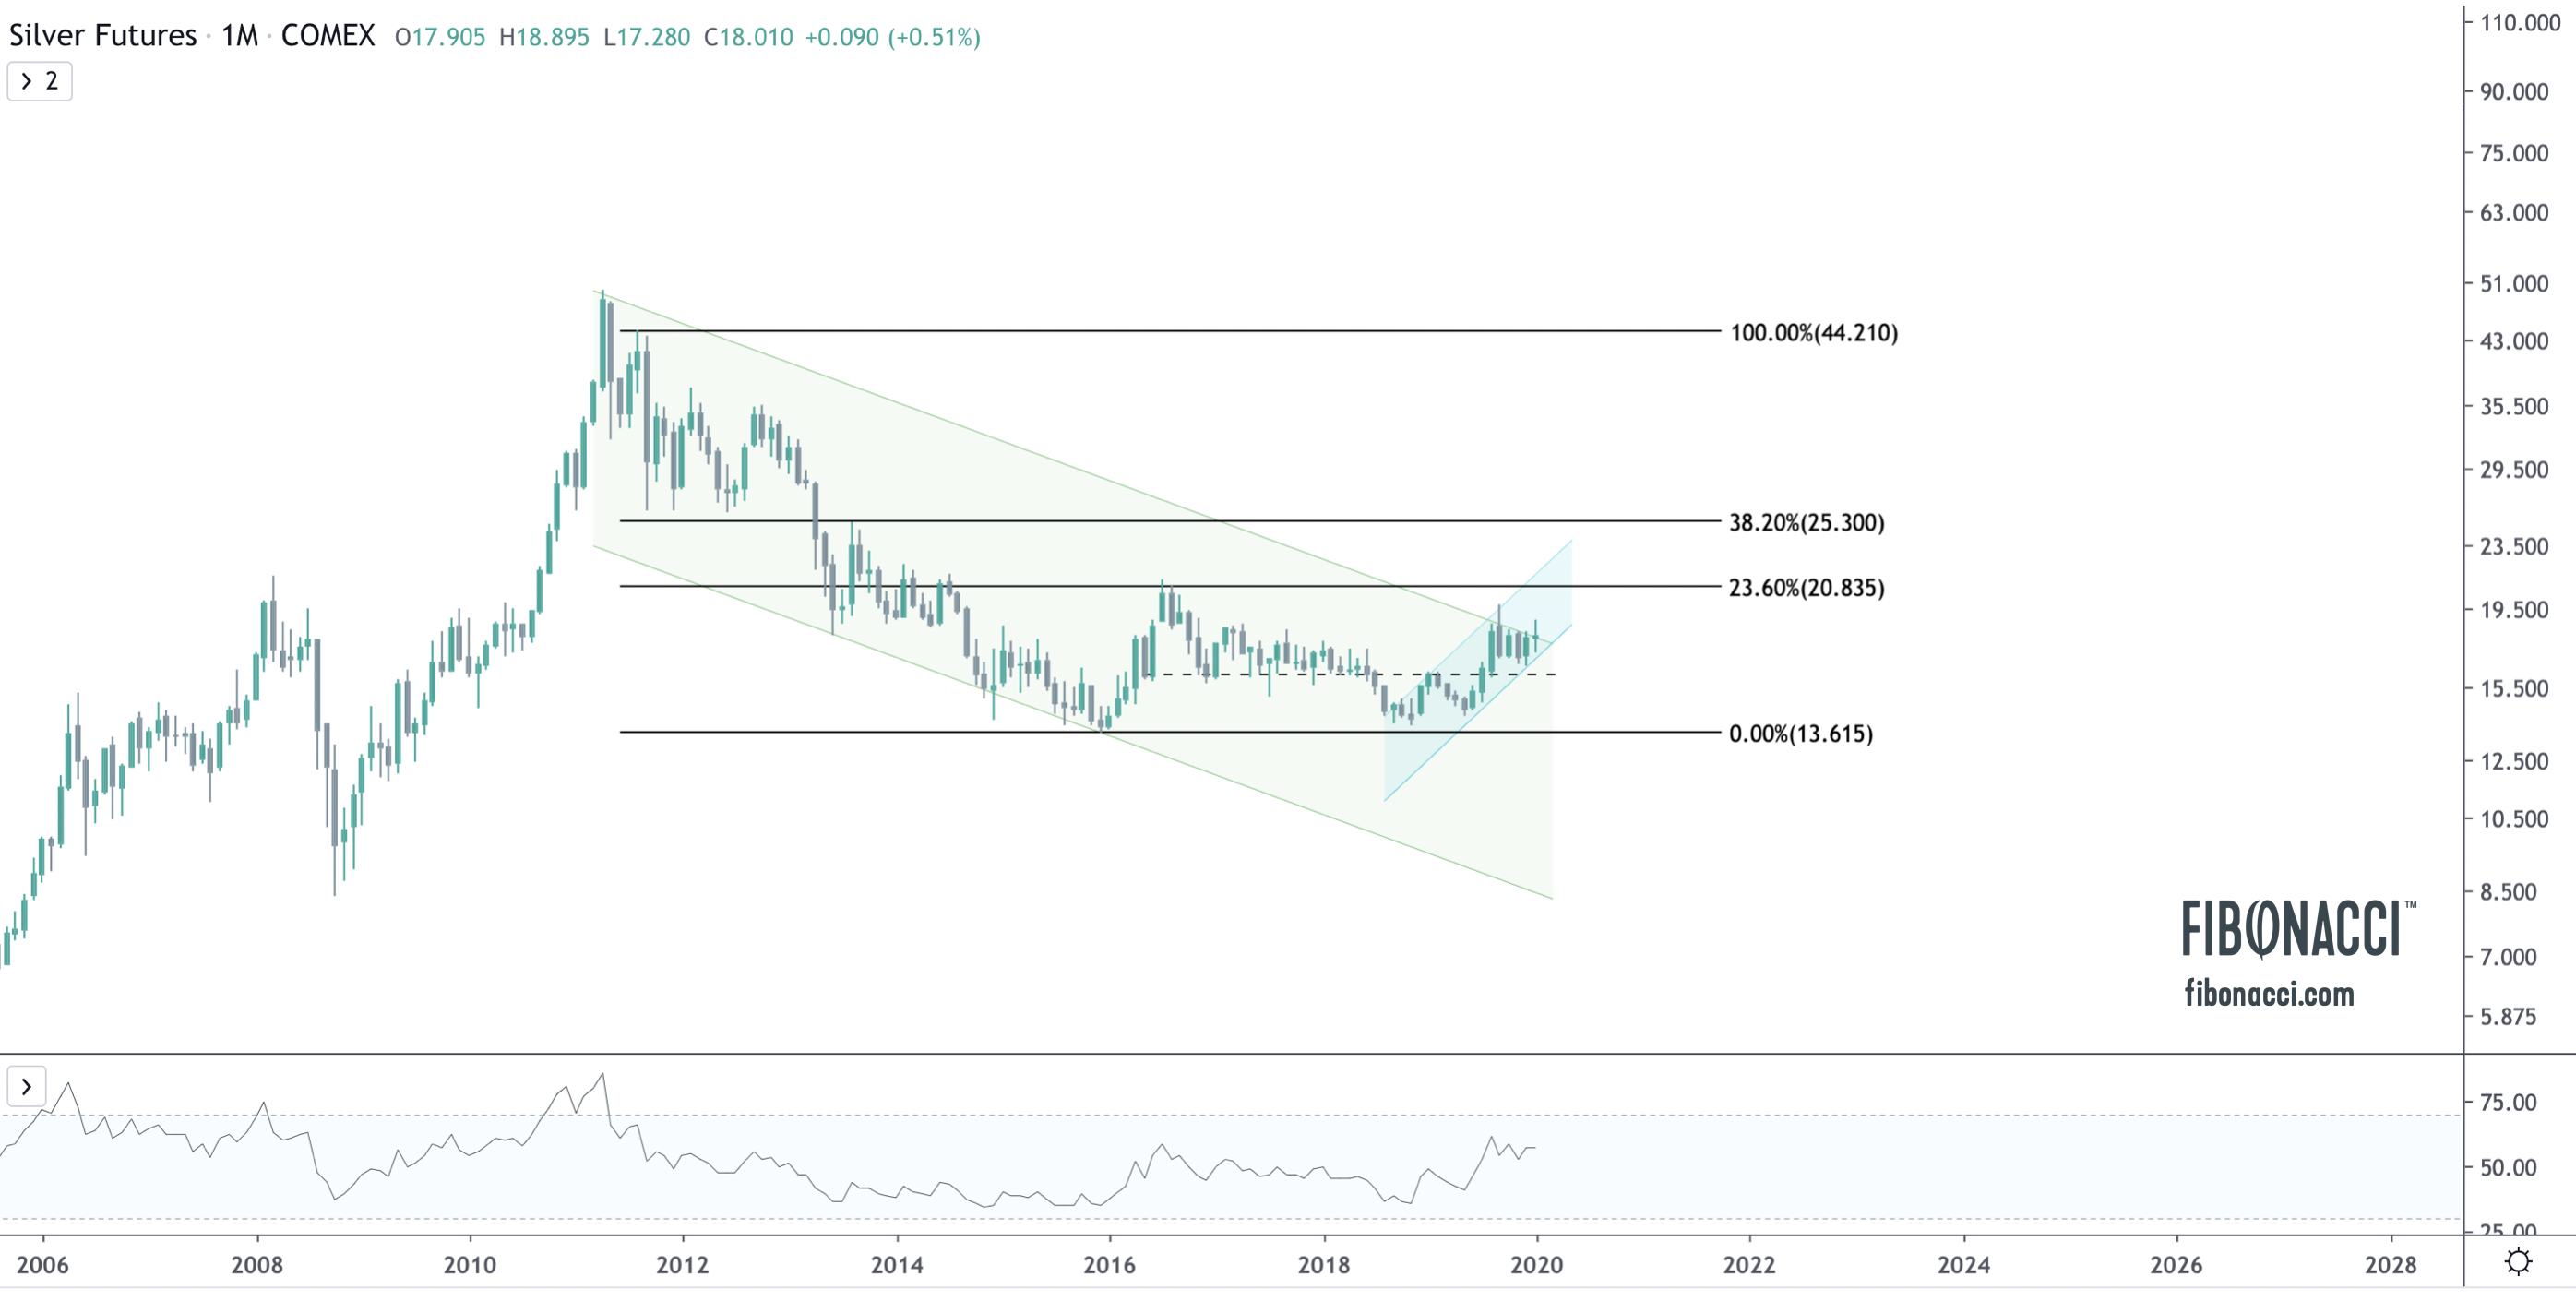
Gold bulls would now like to see follow through in the price of silver, which has lagged throughout the recent run up. Silver now sits at the nexus of a nine-year falling channel (falling resistance) and an 18-month rising channel (rising support). The long-legged January doji candle is a symbol of indecisiveness. A breakout in February would set up a run to the 23.6 fibonacci retracement at ~$21, which is an area of overhead resistance. Bulls would need 16.20 to hold on the downside in the event of a price reversal.
As always, I hope this is helpful, and I welcome any feedback or questions.

Sorry, you must be logged in to post a comment.