Gold Demand Trends Q1 2017

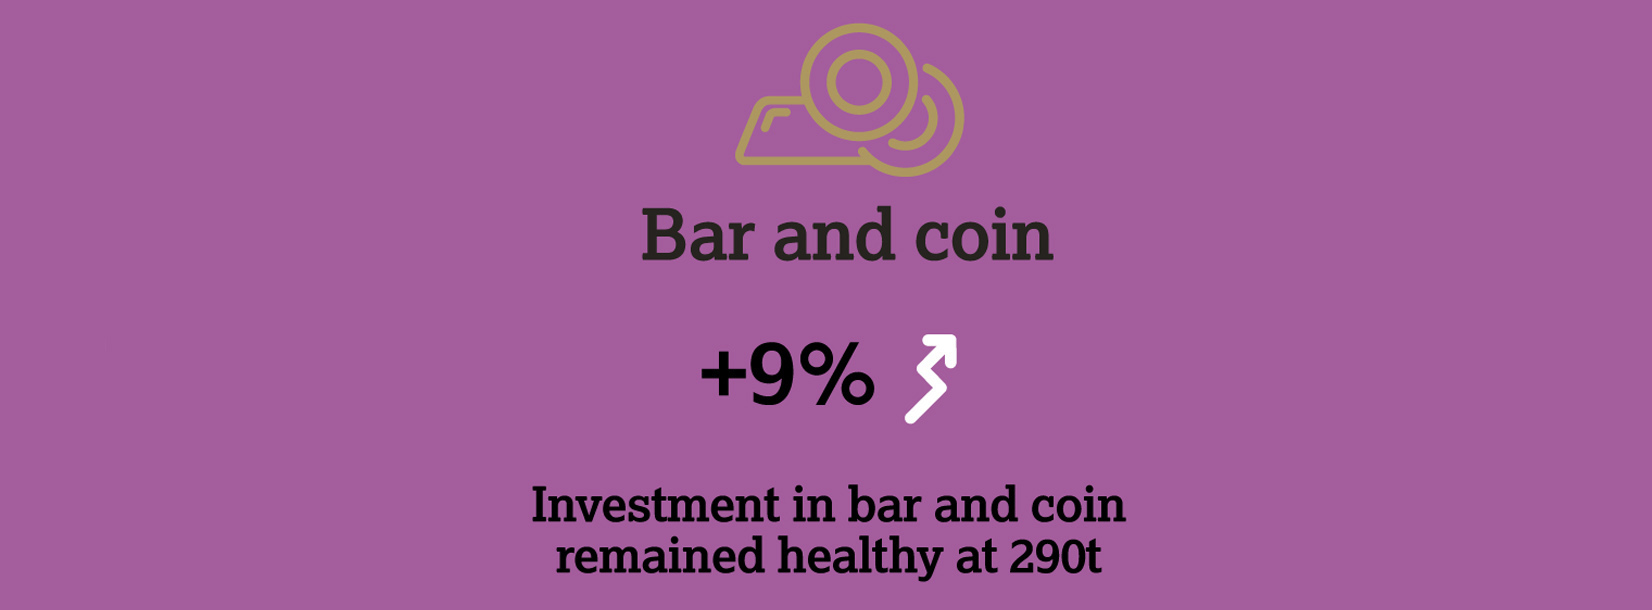
Global gold demand in Q1 2017 was 1,034.5t. The 18% year-on-year decline suffers from the comparison with Q1 2016, which was the strongest first quarter. Inflows into ETFs of 109.1t, although solid, were nonetheless a fraction of last year’s near-record inflows. Slower central bank demand also contributed to the weakness. Bar and coin investment, however, was healthy at 289.8t (+9% y-o-y), while demand firmed slightly in both the jewellery and technology sectors.
Inflows into gold-backed ETFs of 109.1t were concentrated in Europe. Although inflows were just one-third of the extraordinary levels seen in Q1 2016, demand was firm. European-listed products were the most popular, due to continued political uncertainty in the region.
Investment in gold bars and coins grew by 9% y-o-y. Much of this growth came from China, where retail investment was up 30%, breaching 100t for only the fourth time on record.
First quarter jewellery demand was steady at 480.9t, marginally up on Q1 2016. Gains in India were the main reason for the slight y-o-y increase, but global jewellery demand remains relatively weak in a historical context.
After a whirlwind end to 2016, Indian consumers enjoyed a period of relative stability in the domestic market, buoying demand. Continued remonetisation by the RBI lifted consumer sentiment, which encouraged demand ahead of the auspicious wedding season, albeit from a very low base.
Central bank demand for gold continued to slow: 76.3t were added to reserves. Central banks showed a diminished appetite for gold purchases; China’s purchasing program was on pause during the quarter as its foreign exchange reserves remained under pressure. Sales, once again, were sparse.
FOR MORE INFO, CLICK HERE.


Sorry, you must be logged in to post a comment.