Gold Demand Trends Q2 2017
Q2 gold demand of 953.4t was 10% lower than 2016, while H1 demand slowed 14% to 2,003.8t. Y-o-y comparisons are affected by record ETF inflows in 2016: demand from this sector slowed dramatically after last year’s H1 surge. Central bank net purchases of 176.7t were also slightly lower in the first half (-3%). By contrast, bar and coin investment improved, as did jewellery demand, although the latter remains weak in a long-term context. Technology demand also made modest gains.

ETF inflows slowed dramatically from last year’s record pace. But holdings continued to grow: after adding 56t in Q2, H1 inflows reached 167.9t. European ETFs saw the strongest H1 inflows: holdings in these funds reached a record 977.7t.
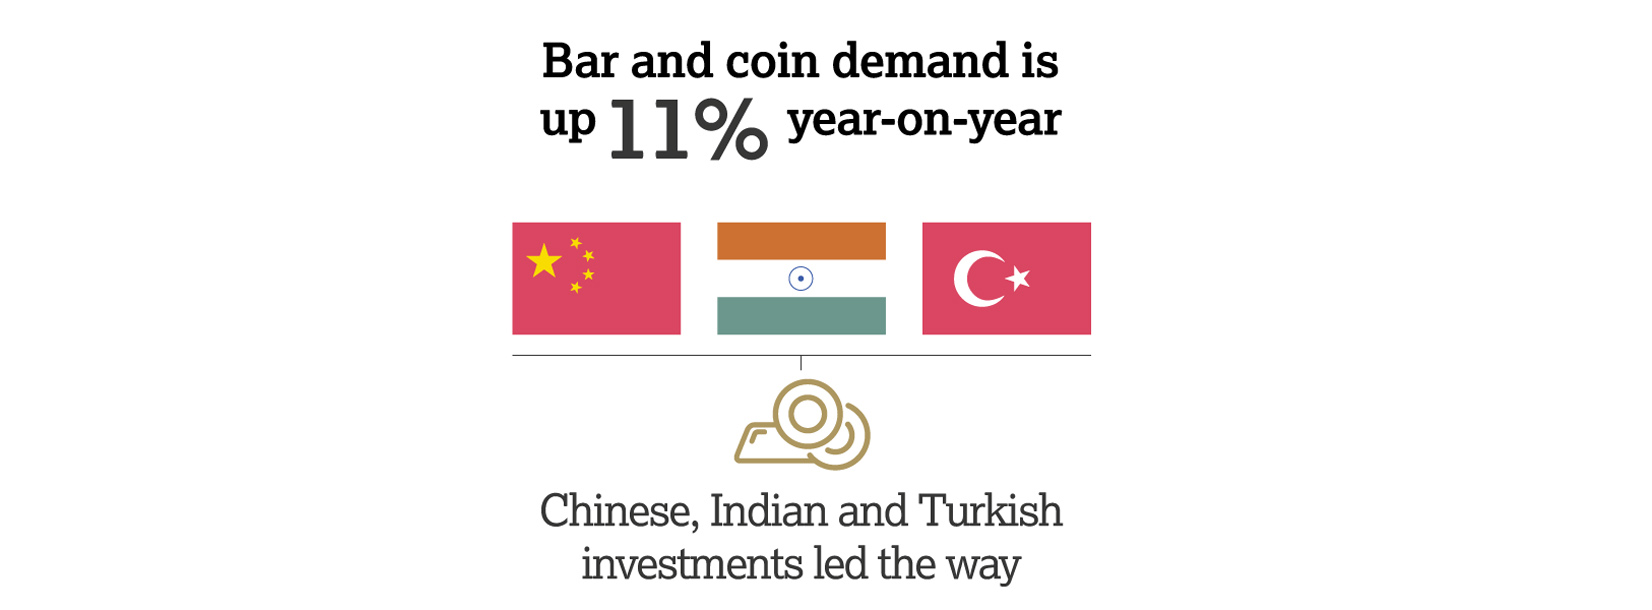
Bar and coin investment rebounded from very low levels. Q2 demand gained 13% from Q2 2016, while H1 demand rose 11%. A strong jump in Turkey was fuelled by economic recovery, double-digit inflation and relative currency stability.
Jewellery demand strengthened from a weak 2016, but fell short of the long-term average. India was the main contributor to the 8% gain in Q2, as it recovered from extremely low 2016 demand.
Central banks continued to buy, but at a more modest pace than in recent years. The most recent quarter saw Turkey’s central bank add to its gold reserves – the first significant purchase since the 1980s.
Technology demand registered its third consecutive quarter of growth: up 2% to 81.3t. Growth in wireless charging and development of features that use LEDs boosted demand. New smartphone handsets supported chip production.
FOR MORE INFO, CLICK HERE.

Sorry, you must be logged in to post a comment.