Map: Economic Might by U.S. Metro Area
The U.S. economy is massive on a global scale, and much of the country’s economic capabilities can be traced back to the innovation, knowledge, and productivity that tends to be clustered in urban areas.
The fact is that 80% of Americans live in cities – and the 10 largest metro areas alone combine for a whopping 34% of the country’s total GDP.
THE 10 LARGEST METRO AREAS BY GDP
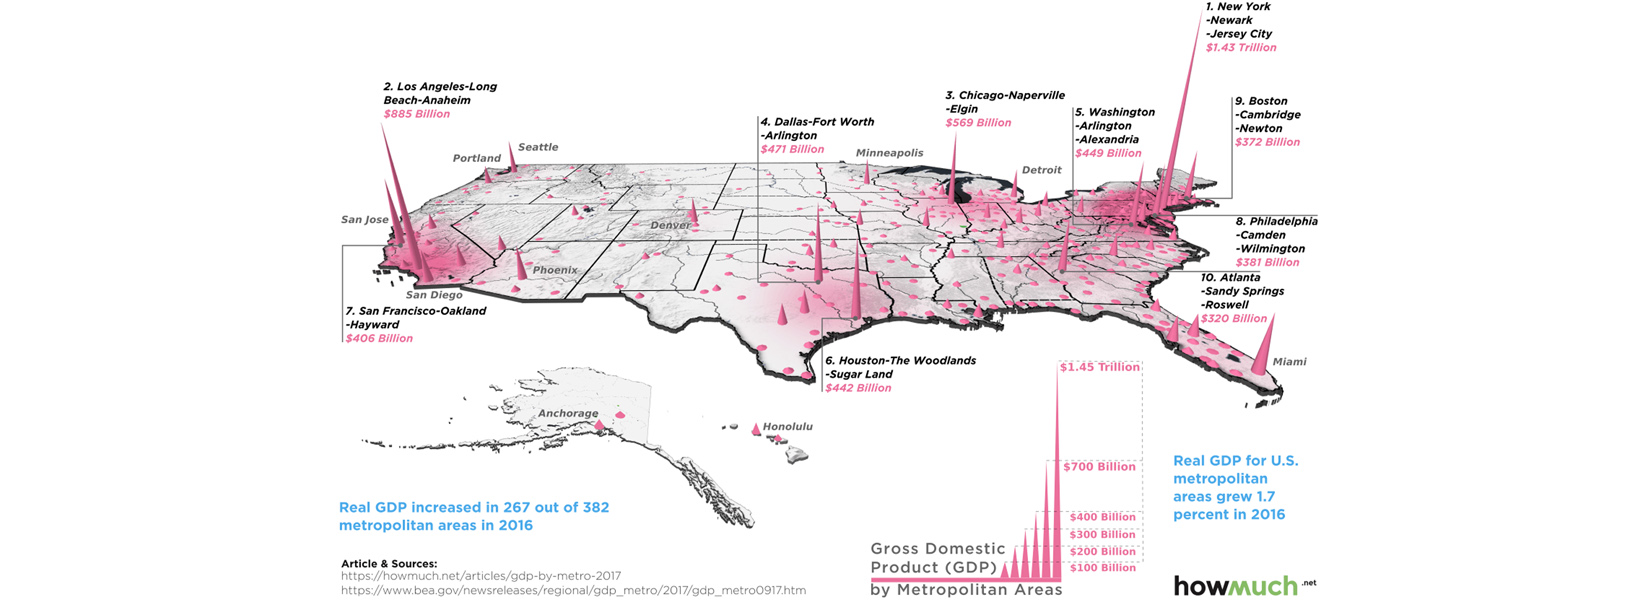
Today’s map comes to us from HowMuch.net, and it highlights recent data from the U.S. Bureau of Economic Analysis that estimates the GDP for each U.S. metro area in 2016:

Not surprisingly, New York City and its surrounding area is the breadwinner here with an annual economic output of $1.43 trillion – the largest for any city in the United States. Impressively, the GDP of the NYC metro area is even higher than those of most of the world’s countries, including Australia, Mexico, and Spain.
It’s also interesting that some metro areas punch above their weight in relation to their population figures. San Francisco is #7 on the list with a GDP of $406 billion, despite having the lowest population total of all of the top 10. Boston and D.C. can be classified similarly, each with a high economic output per capita.
TRENDING UP, TRENDING DOWN
While they can’t quite compete with cities like New York and Chicago in terms of GDP or population, there are actually 300+ other metro areas in the country.
Here’s a recent snapshot from the BEA of which cities are growing – and which are shrinking in terms of GDP:

The BEA noted that real gross domestic product (GDP) increased in 267 out of 382 metropolitan areas in 2016.
The biggest increase was a tie between Lake Charles, LA and Bend-Redmond, OR, each which had GDP climb by 8.1% from the last year. The city that saw the biggest drop was Odessa, TX, which fell -13.3%.

Sorry, you must be logged in to post a comment.