WORLD GOLD COUNCIL GOLD DEMAND TRENDS: 2Q2015

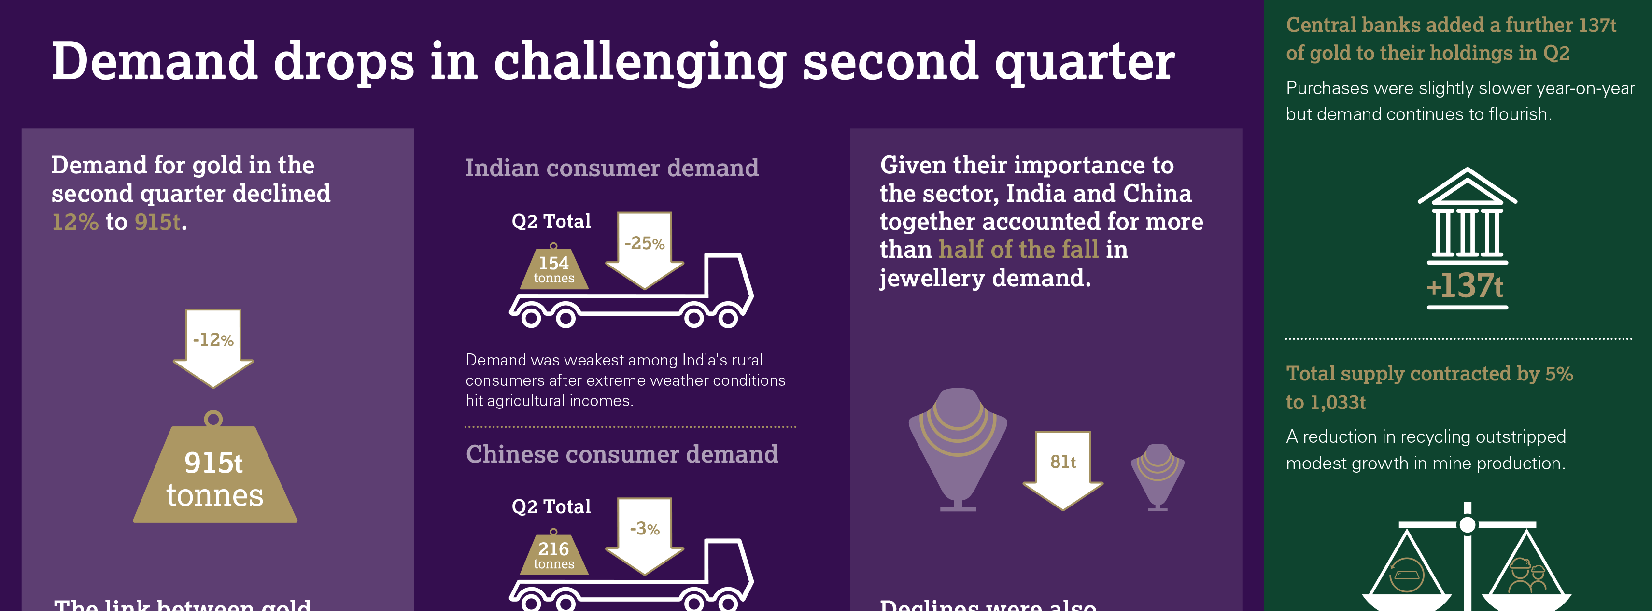
The World Gold Council’s Gold Demand Trends report for Q2 2015 shows total demand was 915 tonnes (t), a fall of 12% compared to the same period last year, due mainly to a decline in demand from consumers in India and China. However, demand in Europe and the US grew, driven by a mixture of increasingly confident jewellery buyers and strong demand for bars and coins. Looking ahead, there are encouraging signs moving into what are traditionally the busiest quarters for gold buying in India and China.
Global investment demand was down 11% to 179t from 200t in Q2 2014. India was the main driver of the fall, down 30% to 37t, due to uncertain price expectations and a buoyant stock market. This was countered by a rise in Chinese bar and coin demand, up 6% to 42t. In Europe, fears of a potential Greek exit from the eurozone saw retail investment in gold reach 47t, a rise of 19% compared to last year. The US also saw strong demand, with retail investment increasing by 7%. Of particular note was the huge burst of activity in June, when bullion coin sales by the US Mint hit a 17-month high.
Gold demand and supply statistics for Q2 2015
• Overall demand was down 12% in Q2 2015 to 915t compared to 1,038t in Q2 2014.
• Total consumer demand – made up of jewellery demand and coin and bar demand – totalled 715t, down 14% compared to Q2 2014.
• Global jewellery demand was 513t, down 14% compared to the same period last year, due to falls in China, down 5% to 174t, as well as India, down 23% to 118t. The US and Europe saw continued growth with the US up 2% to 26t, and Europe up 1% to 15t.
• Total investment demand was down 11% to 179t, compared to 200t in the same quarter the previous year. Demand for bars and coins saw a 15% drop to 201t from 238t the previous year, as the sector was affected by an expected increase in US interest rates and a continued shift towards other asset classes, notably equities. ETFs saw outflows totalling 23t, lower than the outflows of 38t seen in the same quarter last year.
• Central banks continued to be strong buyers of gold, accounting for 137t in Q2 2015, slightly down on the equivalent quarter last year, but up 11% compared to the previous quarter. It was the 18th consecutive quarter where central banks were net purchasers.
• Year-on-year quarterly mine production increased 3% to 787t in Q2 2015, against 763t in Q2 2014. Recycling levels were down 8% year-on-year to 251t compared to 273t in Q2 2014, resulting in total supply falling 5% to 1,033t.
Download the FULL REPORT HERE


Sorry, you must be logged in to post a comment.